
Making IBM Cloud for Financial Services Work for You
See how the unique industry-specific capabilities of IBM Cloud for Financial Services are designed to help you reduce risk and accelerate cloud adoption (including my part in building it).
See how the unique industry-specific capabilities of IBM Cloud for Financial Services are designed to help you reduce risk and accelerate cloud adoption (including my part in building it).
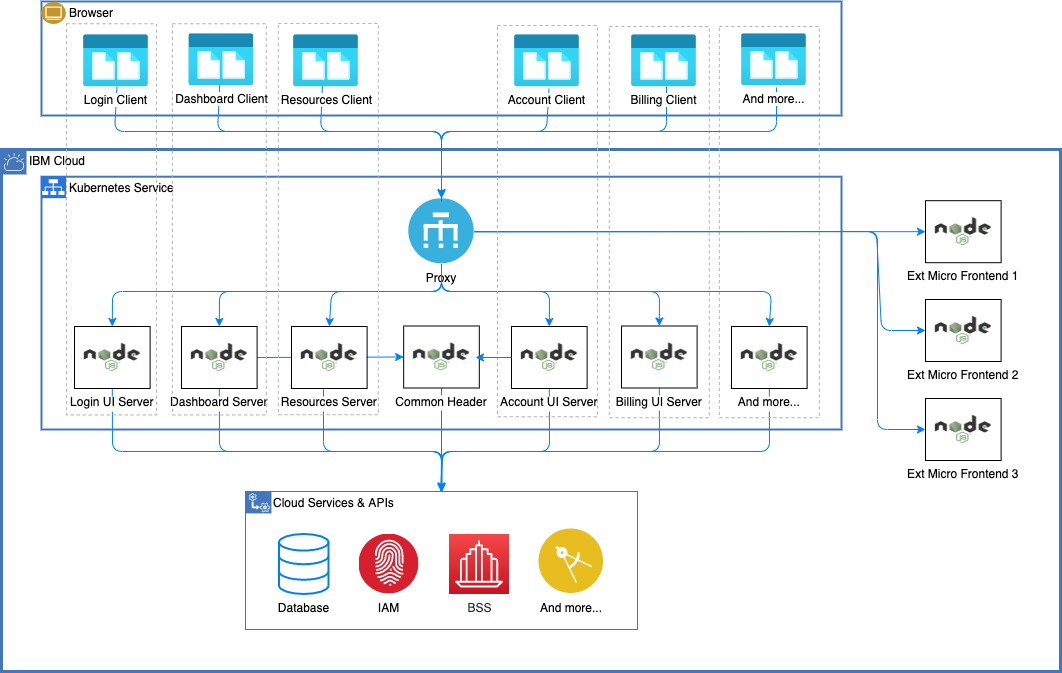
Learn how the IBM Cloud console architecture evolved from its monolithic origins into a highly scalable, modern microservice-based system, and the role Node.js played.
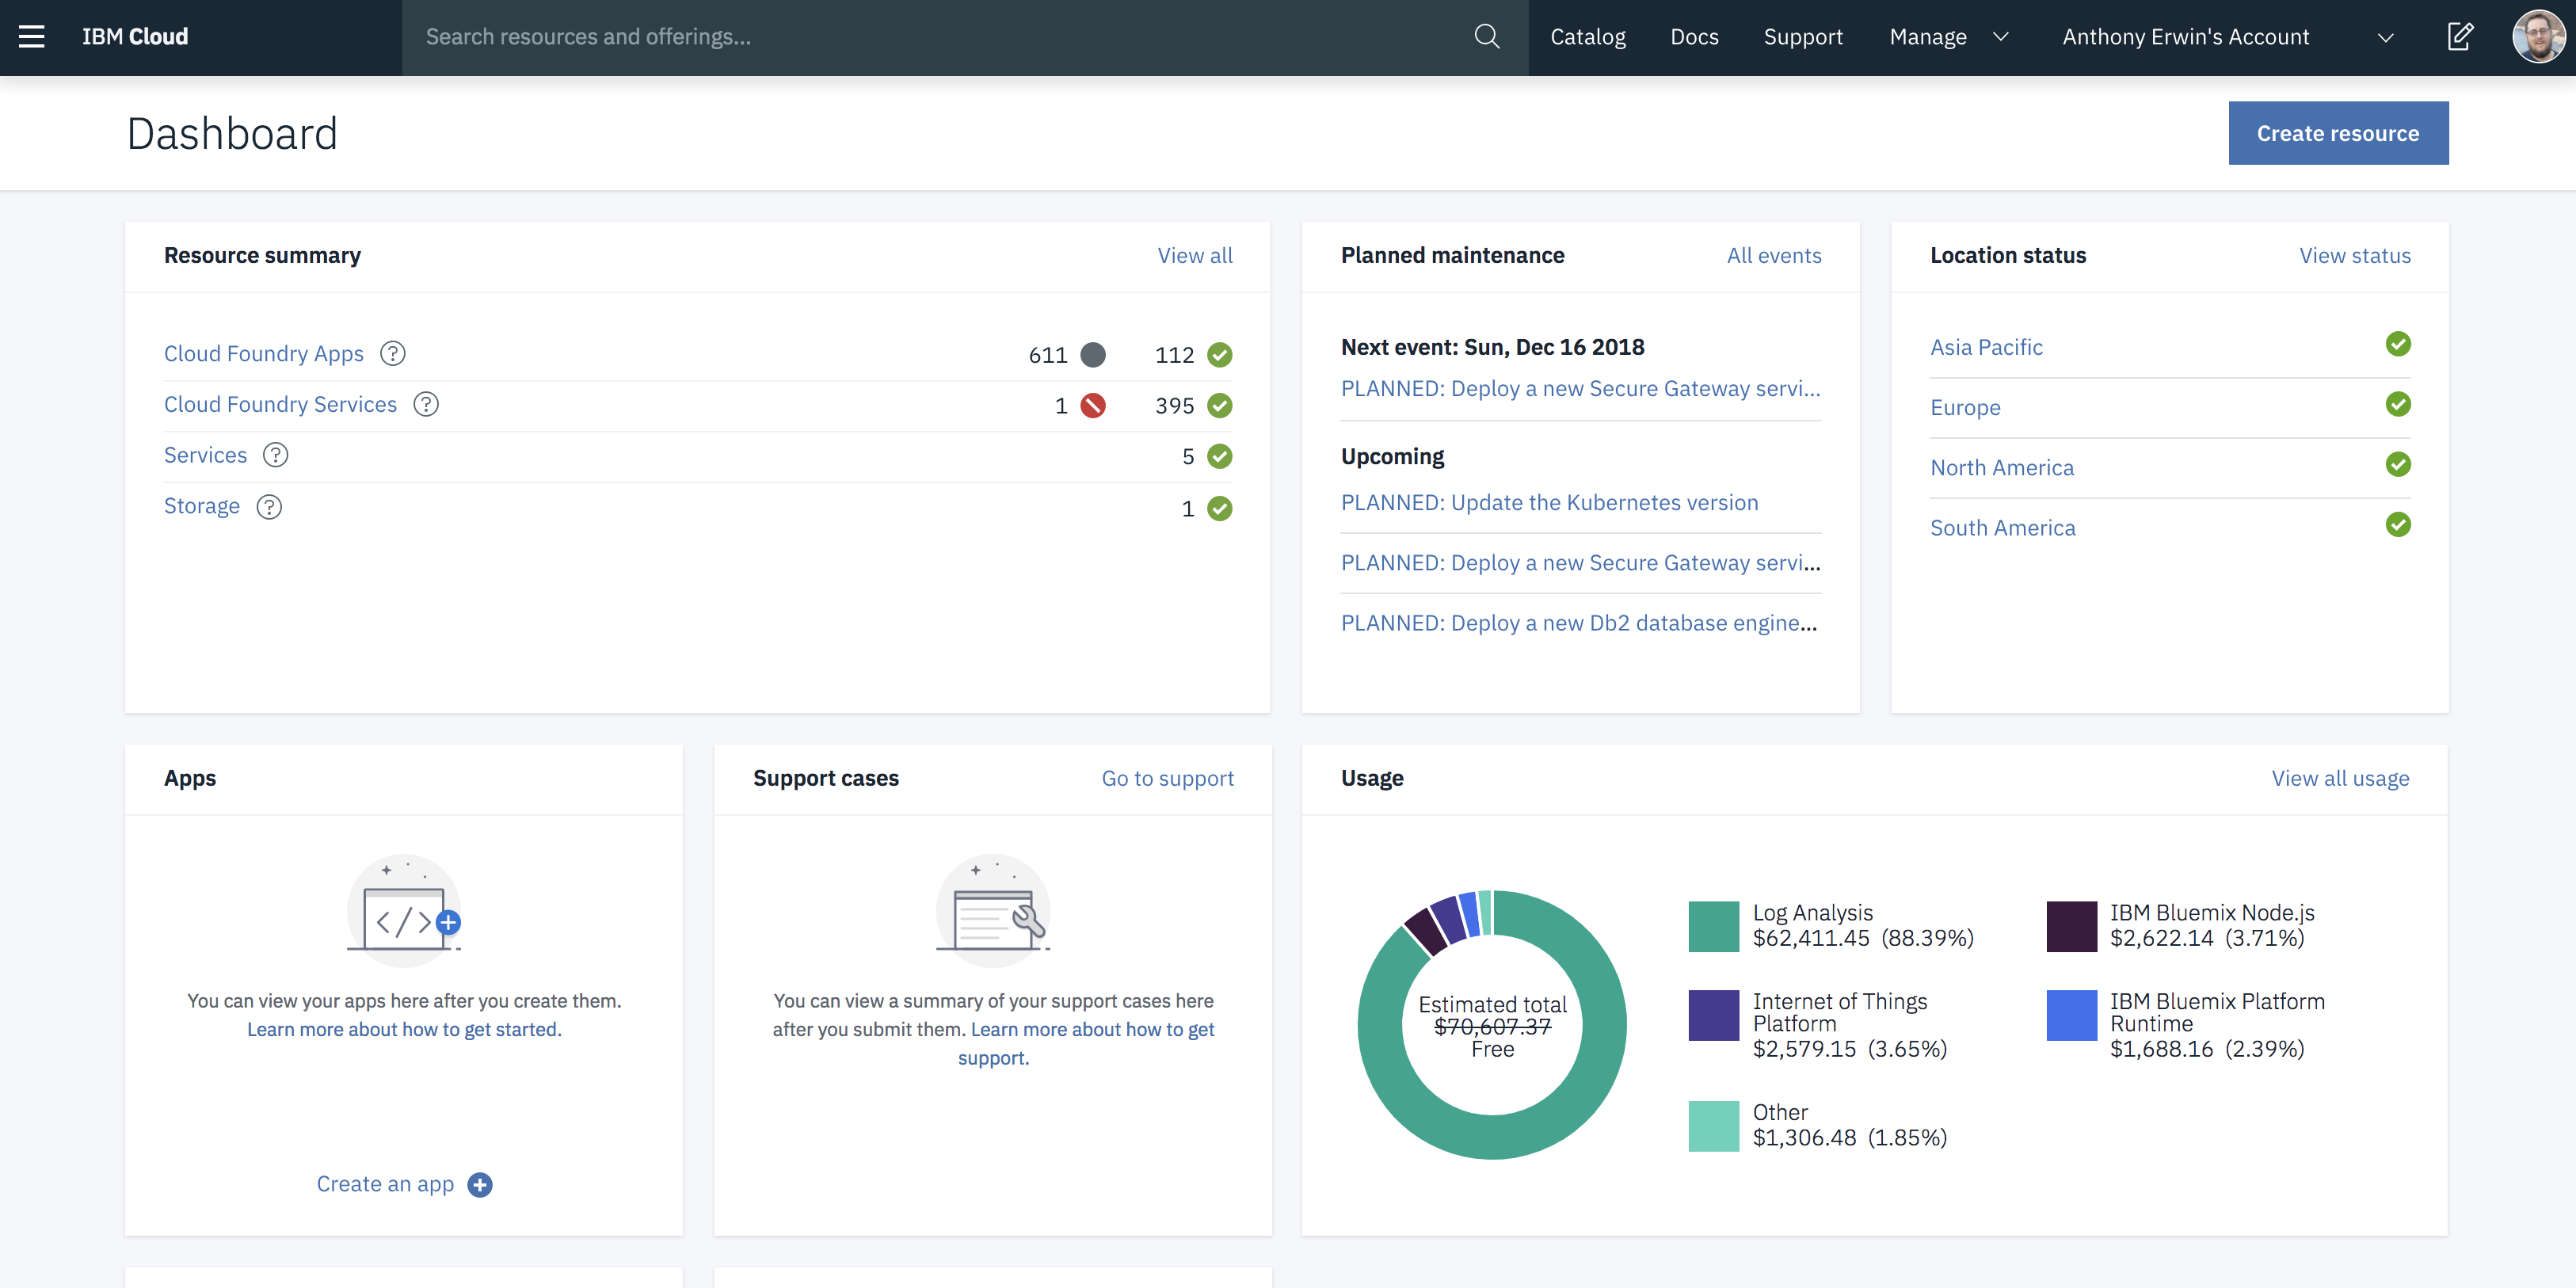
Earlier this month, we launched a revamped IBM Cloud Platform Experience at our new cloud.ibm.com location. Our primary goal was to unify our IaaS and PaaS offerings to better meet your needs. This was a massive undertaking with changes up and down the stack. Prior to this unification, there were two distinct UI's at different URLs -- one for IaaS and one for PaaS. This understandably led to a lot of frustration and confusion. We wanted to fix this by creating a seamless experience with one UI at a single URL to manage everything. We're very excited by the outcome, and we think you will be too.
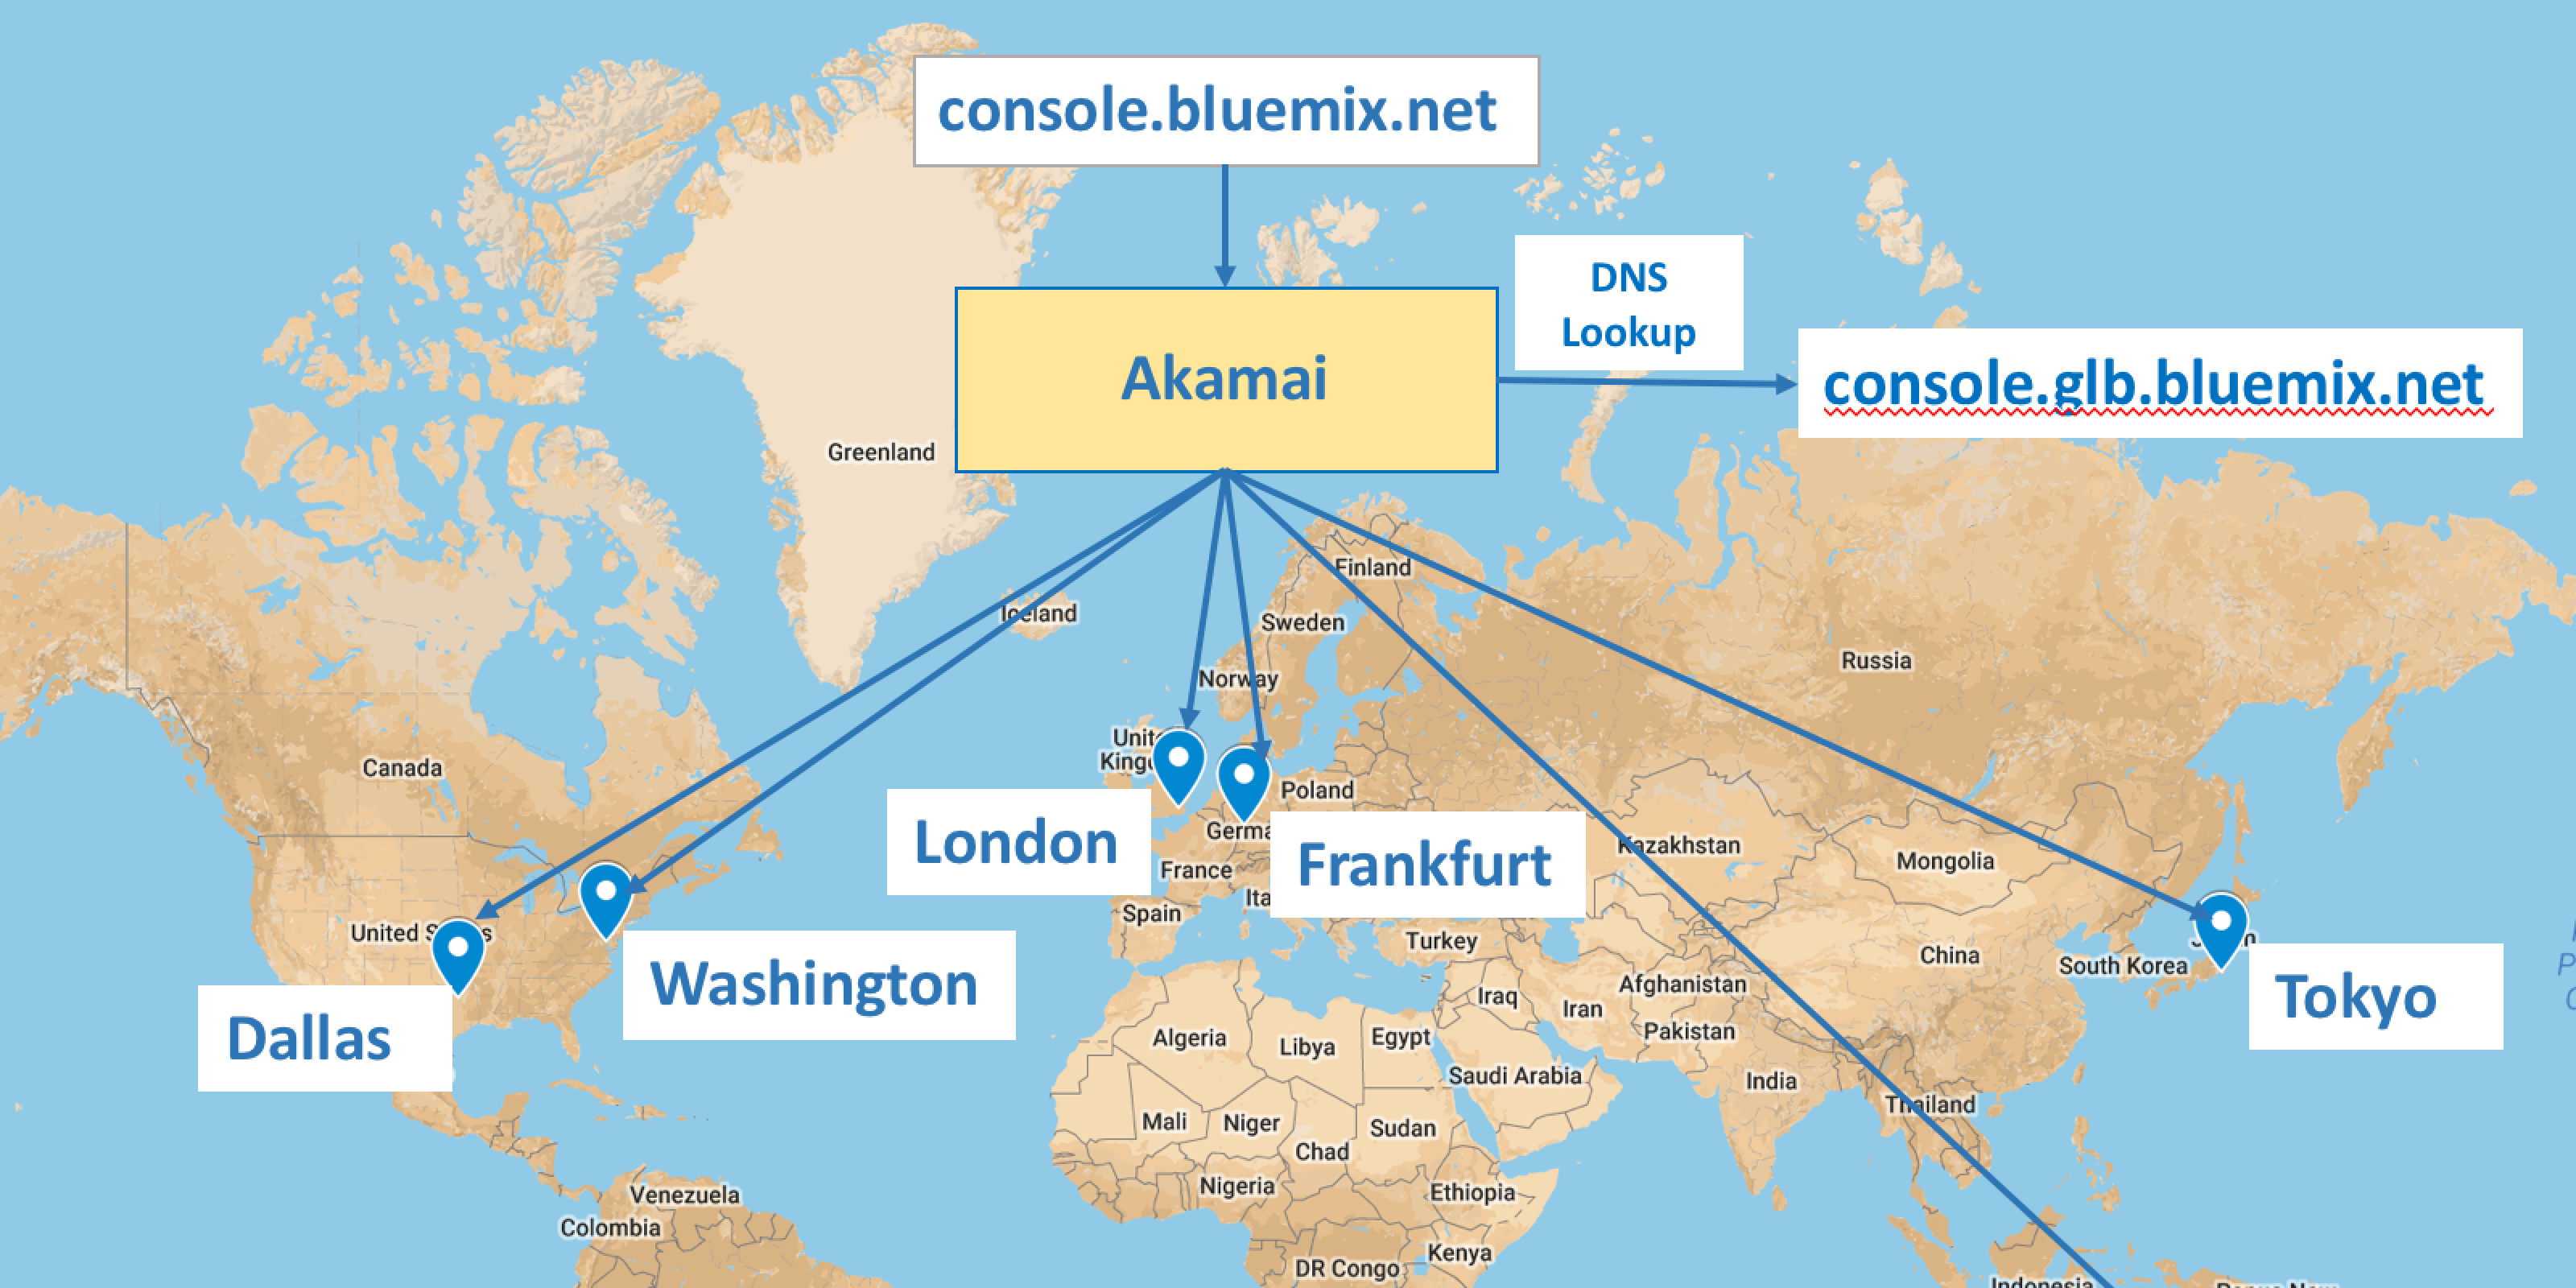
A few months ago, I announced that my team had released the new global IBM Cloud Console allowing all public regions of the IBM Cloud platform to be managed from a single location. This took us from four addresses (one for each of the four public IBM Cloud regions at the time) to a single geo load-balanced address. Users would now always get the UI served from the geographically closest (and healthy) deployment, resulting in improved performance and enabling failover to greatly increase availability. In this post, I'll dig a bit deeper so that you can gain insight into what it would take for you to build similar solutions with your own IBM Cloud apps.

In June, I had the honor of attending the Cloud Foundry Summit Silicon Valley 2017 conference. My two submissions related to Bluemix UI architecture were selected, and I got the chance to present them. One talk centered around migration of the Bluemix UI from a monolith to a microservices architecture, and the other talk focused on best practices around monitoring microservice systems. In this post, I'll briefly describe my talks as well as share some general takeaways from the conference.

We have been listening to your feedback on the Bluemix UI and have used that to design a brand new user experience (UX) that we believe will streamline your workflows. The new experience is now live for your immediate use. In this blog, we'll walk you through the new taxonomy organizing your resources, the redesigned catalog, the updated flows for creating new compute resources, the reorganized app details page, and more!
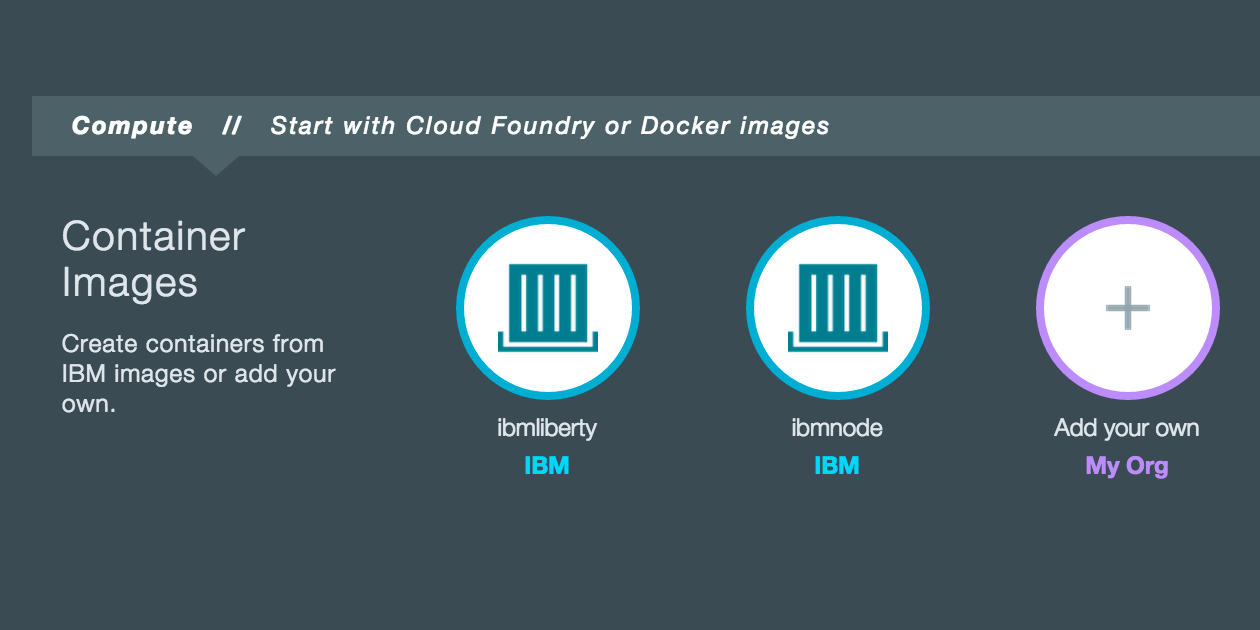
In honor of our first anniversary, we’ve got some big news to share. Several exciting Bluemix updates went live late last week including: 1) official release of IBM Containers, 2) addition of service keys to facilitate connecting to services from outside of Bluemix, 3) usability improvements to the Bluemix UI’s header and dashboard, and 4) enhancements to documentation.
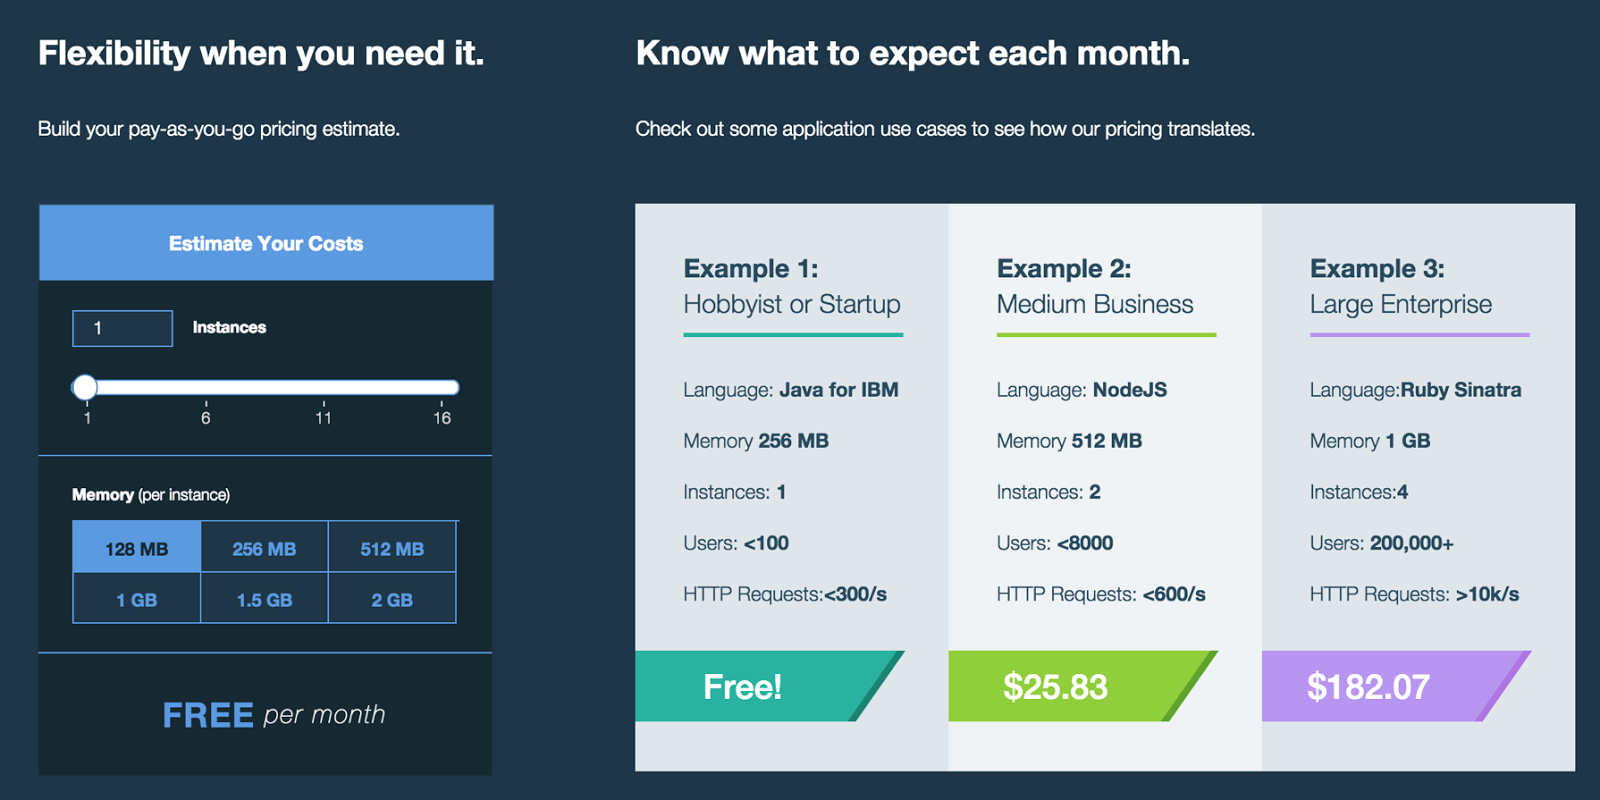
On the eve of Cinco de Mayo, we're pleased to some awesome Bluemix updates that have recently gone live. These include a new and improved Pricing page, introduction of a Labs section in the catalog. overhauled Bluemix Docs with the ability to leave inline feedback, improvements to SSL certificate support for custom domains, ability to communicate with live IBM representatives via text chat and video chat, addition of Korean to the list of translations, enhancements to the API Management and IBM Insights for Twitter services, addition of Watson nodes to the Node-RED boilerplate, updates to IBM Eclipse Tools for Bluemix, and miscellaneous usability improvements and fixed defects.
I’m writing this edition of the blog from Las Vegas as IBM InterConnect 2015 enters its final day. It’s been a great week with lots of exciting news, and I can’t help but reflect how far we’ve come since Bluemix was first announced about a year ago at IBM Pulse. As Bluemix continues to mature and gain momentum, I’m excited to share details about the awesome Bluemix updates that went live in the UI this week.
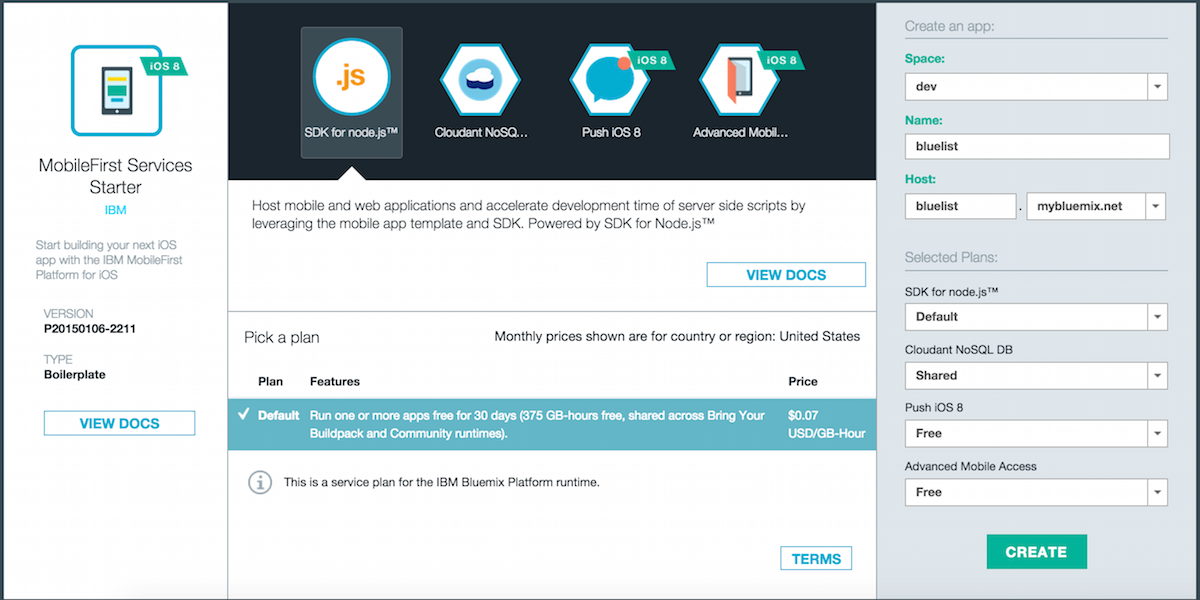
We’ve got some exciting Bluemix updates to kick off 2015 which include 1) Integration of the IBM MobileFirst Platform for iOS, 2) Enhancements to the iOS Solutions page, 3) Ability to enable an existing Node.js app to serve as the backend for mobile clients, and 4) Addition of a simplified path for creating both web and mobile apps.